Research Article | | Peer-Reviewed

Yearly Assessment of Weather and Air Quality Impact on Respiratory Disease Hospitalizations: Faial Island (Azores) Study

Received: 28 September 2024     Accepted: 17 October 2024     Published: 18 November 2024
Views:       Downloads:
Abstract

Building upon our previous research conducted at weekly and monthly intervals, this study investigates the yearly dynamics of weather conditions and air quality on respiratory diseases, specifically tailored to Faial Island in the Azores. Expanding our analysis to a yearly basis allows for a more comprehensive understanding of long-term trends and seasonal variations in hospital admissions. Drawing upon extensive daily data spanning from 2008 to 2019, sourced from the Statistics Service of Hospital da Horta, the Meteorological Observatory Príncipe Alberto de Mónaco, and the Air Quality Monitoring Network of the Azores, we examined the differentiated relationships between yearly meteorological variables, such as temperature, dew point, and wind direction, and respiratory health outcomes. Additionally, we explored the persistent influence of air quality indicators, including suspended particulate matter with an aerodynamic diameter of 10 micrometers (µm) or less (PM10), sulfur dioxide (SO2), nitrogen dioxide (NO2), and ozone (O3), across different seasons and years. By incorporating yearly data into our analysis, this study aims to provide a comprehensive and nuanced understanding of the interplay between environmental factors and respiratory disease hospitalizations, thereby informing targeted interventions and public health strategies in insular regions. The principal component analysis (PCA) applied to the yearly data reveals interesting correlation patterns between meteorological variables and hospitalizations for respiratory diseases such as asthma, pneumonia, and rhinitis. Hospital admissions were found to increase during periods of lower temperatures and smaller temperature amplitudes, suggesting that prolonged cold conditions may exacerbate symptoms of these diseases. Additionally, atmospheric pollutant concentrations, such as suspended particles PM10, SO2, NO2, and O3, significantly varied across seasons, with a notable influence on the exacerbation of respiratory diseases. In insular regions like the Azores, these findings highlight the importance of targeted public health strategies to mitigate the impact of environmental factors on respiratory health.

Published in American Journal of Health Research (Volume 12, Issue 6)
DOI 10.11648/j.ajhr.20241206.12
Page(s) 165-178
Creative Commons

This is an Open Access article, distributed under the terms of the Creative Commons Attribution 4.0 International License (http://creativecommons.org/licenses/by/4.0/), which permits unrestricted use, distribution and reproduction in any medium or format, provided the original work is properly cited.

Copyright

Copyright © The Author(s), 2024. Published by Science Publishing Group

Keywords

Respiratory Diseases, Hospital Admissions, Meteorological Parameters, Air Quality, Azores Region

1. Introduction
Climate and health are interconnected. Climate change, variability and extreme weather events have severe and complex impacts on our health and well-being. according to World Meteorological Organization only 23% of Ministries of Health use meteorological information to monitor climate sensitive health risks. It is commonly acknowledged by several authors that weather conditions and air quality play a crucial role in the onset and worsening of respiratory ailments, but the exact mechanism is not clear. Considering the study , the adverse effects of climate change on health will be manifested through various distinct interactions. There is substantial evidence, as indicated in reference , demonstrating a significant association between exposure to PM2.5 and cardiovascular and respiratory disease morbidity, and mortality . Fluctuations in humidity and temperature, but not barometric pressure, appear to influence emergency department visits for pediatric asthma function, referencing the study . One theory proposes that cold air conditions result in dehydration within the airways, triggering inflammation and subsequently leading to asthma attacks, cited in the study . Another theory proposes that the combination of cold and dry air escalates the evaporation of surface fluid in the airways, considering the study . Also, research indicates that fluctuations in certain weather parameters such as temperature or humidity may induce airway inflammation in individuals with asthma, according to the study . Moreover, numerous studies suggest that extreme temperatures (both cold and hot) and high winds can elevate the risk of hospitalizations among asthma sufferers . In the contrary, other authors found no correlation between weather variables and asthma hospitalizations, according to the study . Although studies are developed based on laboratory experiments, most of them are based on the determination of statistical relationships between these atmospheric parameters and hospital admissions (visits to hospital services: emergency and admissions. On the other hand, inconsistencies in methodological approaches and different statistical analyses shown in the vast literature, excluding justifications of physical and physiological aspects, do not recommend procedures or suggest practice. In the case of asthma, considering the study , most studies conducted are based on a small number of meteorological (air temperature and relative humidity) and air quality (particulate matter and pollens) parameters. Moreover, concerning asthma and, according to the typical patterns of incidence and prevalence of this disease studies are almost always related to certain age groups (children versus adults) and sometimes sex (female versus male) . Global mortality from respiratory diseases has been increasing consistently over the last 20 years, constituting the third leading cause of death after circulatory system and malignant tumors. The increase in respiratory mortality is notable from the nineties onwards, contrasting with the opposite trend observed in diseases of the circulatory system, taking into account the study .
The publication Health Indicators 2013 - 2018 of the Regional Health Secretariat of the Azores indicates that respiratory system diseases are the third cause of death in the Azores region after circulatory system diseases and neoplasms. In the publication we also found complementary information on the distribution of deaths by the age group revealing an increase in the number of deaths from 60 years of age and especially above 75 years of age. This trend has a clear contribution from pneumonia and the so-called "other Chronic Lower Airway Diseases" but is not so evident in the case of asthma (or "other Chronic Lower Airway Diseases: Asthma and Asthmatic Malaise"). On the other hand, it is suggested that in the younger age groups (< 15 years) and childhood (< 5 years), the number of cases is residual and by comparison with the older ones (> 60 years).
This demographic insight underscores the urgency of understanding and addressing the factors contributing to respiratory diseases in the Azores region. In a previous study , our group conducted both a weekly and monthly analysis of hospitalization rates for respiratory conditions, revealing distinct seasonal trends. Asthma-related admissions peaked during winter months when temperature fluctuations were minimal, indicating a correlation with colder temperatures and narrower thermal amplitudes. Conversely, lower asthma cases coincided with higher average daily wind speeds during summer, suggesting a potential association with airborne particulate matter stirred by wind. Similarly, pneumonia cases exhibited a seasonal pattern, reaching a peak in late winter when dew point values were lower, hinting at a relationship with specific humidity levels. While rhinitis cases did not exhibit a clear seasonal pattern, notable peaks were observed in late winter and late spring. Minimum temperature analysis revealed a correlation with rhinitis cases, with colder days potentially exacerbating the condition. However, the reasons behind the seasonal variations in rhinitis cases remain unclear.
Considering the demographic trends and seasonal patterns uncovered in our previous study, our current investigation is also motivated by the observable effects of global climate change in the Azores region, such as rising carbon dioxide (CO2) levels and extreme weather events like droughts and heavy precipitation, according to the study . Changes in atmospheric pressure and wind patterns, particularly in the intensification of the North Atlantic Subtropical Anticyclone, are indicative of broader climatic shifts, referencing the study . These changes, including decreased wind speeds and alterations in cloud patterns, could have significant health implications, underscoring the importance of understanding and addressing them effectively, according to the study . The impact on human health will be significant depending on our knowledge and prepared-ness to face them, cited in the study
2. Methods
2.1. Study Location
In the subtropical North Atlantic, the Azores archipelago is greatly shaped by the Azores High, a semi-stationary high-pressure system dictating weather patterns and air mass movements. Moreover, the region's climate is influenced by its proximity to the Gulf Stream, a warm ocean current that moderates’ temperatures and ensures consistent precipitation.
Among the Azorean islands, Faial, located at the western end of the central group, is notable for its irregular pentagonal shape and a population primarily concentrated in Horta city. Faial covers approximately 172.43 km², cited in the study .
The Azores Archipelago has a temperate oceanic climate characterized by low thermal amplitude (average temperature values vary between 14°C and 18°C in coastal regions and between 6°C and 12°C in the highland), high humidity, persistent winds, and significant seasonal and interannual variability in precipitation, according to the study .
2.2. Data Sources
The hospitalization data analysis in this study focuses on the daily access to the emergency and admissions at Horta Hospital. Utilizing epidemiological, meteorological, and air quality data spanning from 2008 to 2019, the study examines patterns and trends related to respiratory conditions. The epidemiological dataset includes daily records of hospitalizations, encompassing visits to the emergency department, for individuals diagnosed with respiratory ailments such as asthma, pneumonia, and rhinitis. These data were sourced from the statistical services of Horta Hospital on Faial Island. Meteorological da-ta, including variables like temperature, humidity, and atmospheric pressure, were collected from an automated weather station located at the Principe Albert de Monaco Observatory, also situated on Faial Island. This weather station is part of the surface meteorological network operated by the Portuguese Institute of the Sea and Atmosphere (https://www.ipma.pt). Air quality data were obtained from the Espalhafatos station located on Faial Island, which is part of the air quality monitoring network operated by the Region of the Azores: http://qualidadedoar.azores.gov.pt/DadosValidados.aspx.
2.3. Data Analysis
For the analysis of the influence of atmospheric conditions on respiratory diseases, comprehensive time series analyses were conducted. This included the preparation of time series data for box plots and normalized variables, allowing for a detailed examination of trends and variability over time. Additionally, principal component analysis (PCA) was employed to identify the main components of variation in the data and their relationship to respiratory disease outcomes.
All graphical representations presented in our analysis, including the box-whisker plots, were meticulously created using MS Excel.
3. Results
This study analyzed the number of daily admissions to the Hospital da Horta on Faial Island for respiratory diseases, including asthma, pneumonia, and rhinitis, over the period from 2008 to 2019. The data revealed significant variations in hospitalization rates across different years and age groups, influenced by both meteorological conditions and air quality factors.
3.1. Overview of Hospital Admissions for Respiratory Diseases
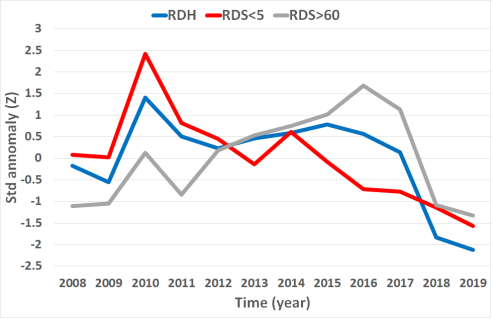
Figure 1. Normalized series of the average annual number of admissions with respiratory diseases in the Hospital da Horta, for the period from 2008 to 2019.
From 2008 to 2019, the highest number of respiratory disease hospitalizations (RDH) was recorded in 2010, particularly among children under five years of age (RDS<5), as shown in Figure 1. This peak underscore the heightened vulnerability of this age group to respiratory infections during that year. Following 2010, a steady decline in RDH suggests improvements in pediatric healthcare or changes in environmental factors influencing this demographic. In contrast, 2019 saw the lowest RDH rates, especially among those over 60 years old (RDS>60), which may indicate enhanced healthcare management or shifts in environmental conditions impacting respiratory health in older adults. Figure 1 also highlights fluctuations in RDH over the years, with notable peaks observed in 2010, 2016, and 2017. However, the trend for the RDS>60 group does not show a consistent increase, reflecting variability rather than a clear upward or downward pattern. The RDS<5 group, on the other hand, demonstrates a significant and sustained reduction in hospitalizations since 2010, suggesting marked improvements in managing respiratory health within this vulnerable population.
3.2. Asthma Hospitalizations
Asthma hospitalizations have shown distinct trends over the years, with noticeable fluctuations among different age groups. From 2008 to 2019, there were significant peaks in hospital admissions, particularly in 2008 and 2017, reflecting periods of increased asthma cases. This pattern is especially pronounced among older adults (ASTHMA>60), who experienced notable surges in hospitalizations, likely influenced by demographic changes on Faial Island and environmental factors such as climate shifts and air quality variations.
In contrast, the data for children under five years (ASTHMA<5) indicate consistently low hospitalization rates, with minimal variability over the years. This suggests that asthma has had a relatively lower impact on this age group, possibly due to effective management practices or a lower prevalence of the condition.
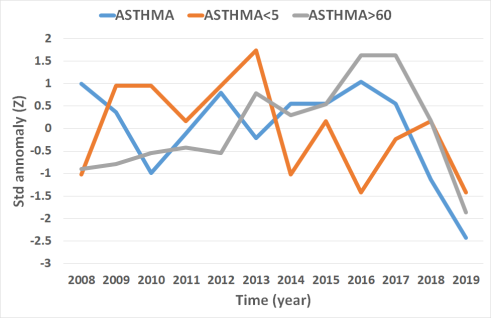
Figure 2. Normalized series of the average annual number of admissions with asthma in the Hospital da Horta, for the period from 2008 to 2019.
Since 2017, there has been a general decline in asthma related hospitalizations across all age groups, reaching the lowest levels in 2019. This reduction may be attributed to improved asthma management strategies, enhanced air quality, or other preventative measures that have helped to mitigate exacerbations. The decrease in pediatric hospitalizations further points to advancements in managing asthma among children, reflecting the success of targeted health interventions.
Conversely, the rise in hospital admissions among older adults highlights the need for specialized healthcare strategies to address the unique challenges faced by this demographic. The observed trends emphasize the importance of continued research and adaptive public health policies to effectively manage asthma and reduce its impact across different age groups.
The data reveals a complex and evolving picture of asthma hospitalizations, necessitating focused efforts to ensure that both young and older populations receive the necessary care and resources to manage their condition effectively.
3.3. Pneumonia Hospitalizations
The data on pneumonia-related hospitalizations reveals several important trends. As shown in Figure 3, total admissions for pneumonia peaked in 2016, followed by a noticeable decline in subsequent years, reaching the lowest level in 2019. This decline may suggest the impact of milder winters, reduced exposure to risk factors, or improved preventive measures, such as vaccinations. For children under five, admissions peaked in 2014, indicating their high susceptibility to pneumonia due to developing immune systems. Similarly, older adults experienced the highest admissions in 2016, with a significant decrease by 2019, possibly reflecting improvements in preventive healthcare measures. Overall, the decline in pneumonia cases among young children and the elderly points to better healthcare practices and interventions across all age groups.
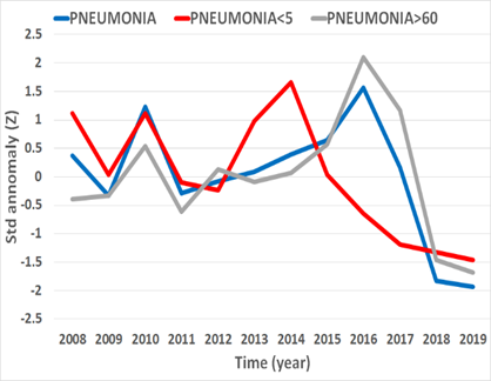
Figure 3. Normalized series of the annual average number of hospitalizations with pneumonia in the Hospital da Horta, for the period 2008.
3.4. Rhinitis Hospitalizations
The data on rhinitis admissions in Figure 4 reveal distinct trends across age groups. Overall admissions for rhinitis were lower than for other respiratory diseases, peaking in 2008 and showing a rising trend from 2011 onwards.
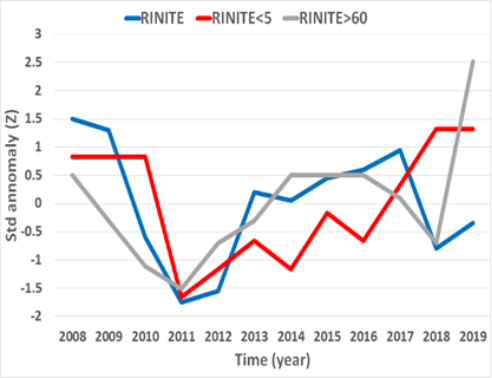
Figure 4. Normalized series of the annual average number of hospitalizations with rhinitis in the Hospital da Horta, for the period 2008.
This increase may be due to greater exposure to allergens or environmental changes affecting rhinitis prevalence. For children under five, peaks in 2008 and 2019 suggest heightened sensitivity to environmental changes or allergens. Among older adults, the highest admissions were in 2008, with a gradual rise from 2011 indicating increased sensitivity to environmental factors. The steady rise in rhinitis admissions across all age groups since 2011 suggests a growing impact of environmental factors potentially linked to climate change, urbanization, and air pollution on allergic respiratory conditions. These observations emphasize the need for targeted public health strategies to address the evolving landscape of respiratory health and mitigate the impact of environmental factors on allergic conditions.
3.5. Meteorological Conditions and Their Impact
3.5.1. Temperature
Meteorological data from the period showed that daily minimum temperatures remained relatively stable. Maximum temperatures exhibited a slight upward trend, indicating an overall warming pattern in daily maximum temperatures.
The analysis of Figure 5 (up) reveals notable trends in daily temperature patterns from 2008 to 2019. Mean (Tm), maximum (Tmx), and minimum (Tmn) daily temperatures show distinct yet interconnected behaviors throughout this period. While minimum temperatures remained relatively stable, the maximum temperatures exhibited a slight upward trend, suggesting an overall warming pattern. This increase in Tmx, alongside the stability of Tmn, indicates a narrowing thermal amplitude, which reflects reduced variability in daily temperature fluctuations.
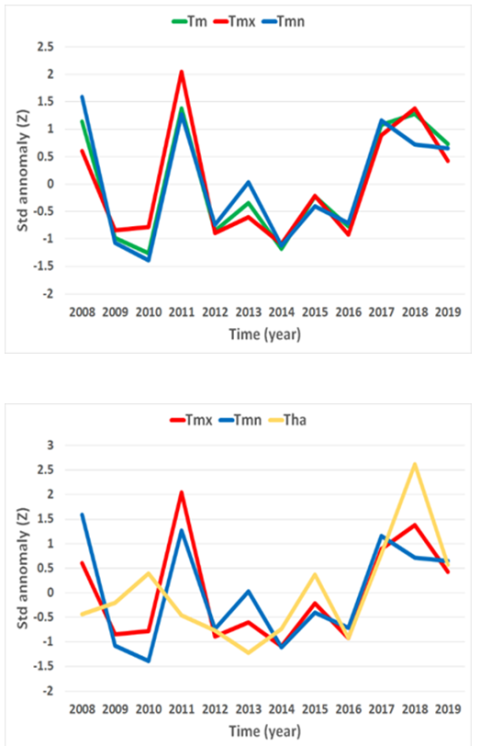
Figure 5. Normalized series of annual averages of mean (Tm), maximum (Tmx) and minimum (Tmn) daily temperatures (up) and daily thermal amplitude (Tha) (down) observed at the meteorological station of Príncipe Alberto do Monaco Observatory (Horta), for the period 2008 to 2019.
During 2010-2011, there was a significant rise in maximum temperatures, peaking sharply while minimum temperatures showed minimal change. This pattern points to a period of increased daytime heat, which could be linked to broader climatic influences. A contrasting phase occurred in 2014-2015, where all temperature measures dipped, indicating a cooler period. The years following, from 2016 to 2018, showed a synchronized upward trend across all temperature metrics, highlighting a warming phase with a marked increase in both daily mean and maximum temperatures.
The overall stability in minimum temperatures suggests less night-time cooling variability, while the upward trend in maximum temperatures points to warming days. This combination could have various implications, such as reducing the frequency of cold-induced health issues but potentially increasing heat-related risks. The narrowing thermal amplitude, due to the reduced difference between daytime and nighttime temperatures, may limit the body’s ability to adapt to rapid environmental changes, impacting respiratory and cardiovascular health.
These findings suggest a broader climatic trend toward warmer conditions and less variability in daily temperatures, underscoring the need for public health strategies that address the evolving impacts of climate change on health and well-being.
In Figure 5 (down), the focus is on the daily thermal amplitude (Tha), maximum temperature (Tmx), and minimum temperature (Tmn) over the period from 2008 to 2019. The graph illustrates how these variables have fluctuated relative to their long-term averages.
During 2010-2011, Tmx saw a pronounced increase, indicating higher daytime temperatures, while Tmn remained relatively stable. This suggests that the increased daytime heat did not significantly affect nighttime cooling. In contrast, during 2014-2015, all temperature measures dipped, suggesting a cooler phase with a reduction in both maximum and minimum temperatures and a narrower thermal amplitude.
The subsequent period from 2016 to 2018 shows a synchronized upward trend across all three metrics. This phase of warming is marked by increases in daily maximum and minimum temperatures as well as a rise in the thermal amplitude, suggesting more pronounced day-night temperature differences. The stability in Tmn during this period indicates that the increase in minimum temperatures was less volatile compared to the maximum temperatures.
These fluctuations in thermal amplitude (Tha) highlight the evolving temperature dynamics, with greater day-night contrasts influencing environmental and health outcomes. Increased thermal amplitude can strain the body’s ability to adapt, particularly affecting those with pre-existing respiratory conditions.
The observed rise in maximum temperatures and reduced variability in minimum temperatures can exacerbate respiratory issues. Higher daytime temperatures contribute to worsening air quality by increasing levels of pollutants like ground-level ozone and particulate matter, which are known triggers for asthma and chronic obstructive pulmonary disease. Additionally, the stability in minimum temperatures may limit nocturnal recovery from daytime heat, leading to prolonged respiratory distress.
The combination of intensified daytime heat and diminished nighttime cooling increases the risk of heat-related respiratory conditions, particularly during heatwaves. These changes underscore the need for public health strategies to mitigate the impacts of rising temperatures on respiratory health, such as better air quality management and public advisories during extreme weather events. Addressing these evolving temperature patterns is crucial for safeguarding the health and well-being of those most vulnerable to respiratory diseases in a changing climate.
These findings underscore the importance of addressing the effects of climate variability on daily temperature patterns and their broader impacts on environmental and human systems.
3.5.2. Precipitation, Humidity, Dew Point, and Wind Speed
Figure 6 (up and down) illustrate the standardized variations in several weather variables from 2008 to 2019, highlighting significant trends and fluctuations that have important implications for public health, particularly in relation to respiratory diseases.
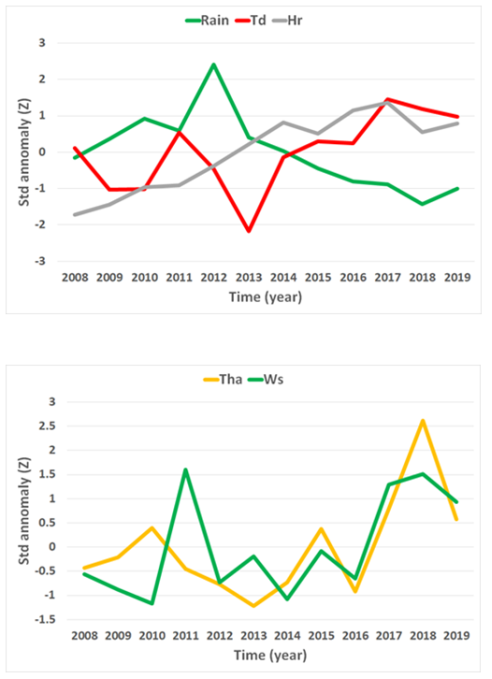
Figure 6. Normalized series of annual averages of daily total precipitation (Rain), daily averages of relative humidity (Hr) and dew point (Td) (up), as well as daily temperature amplitude (Tha) and mean wind speed (Ws) (down) observed at the meteorological station of Príncipe Alberto do Monaco Observatory (Horta), for the period 2008 to 2019.
Figure 6 (up) shows variations in rainfall, dew point, and relative humidity. The data reveals a clear upward trend in dew point and relative humidity, particularly after 2015, indicating a rise in atmospheric moisture. This increase can contribute to higher levels of airborne allergens and pollutants, potentially exacerbating respiratory diseases. Rainfall, however, does not follow a consistent pattern and fluctuates significantly from year to year, with notable peaks in 2011 and 2018 and a sharp decline in 2014. These irregular patterns suggest that changes in atmospheric moisture do not directly translate into predictable precipitation trends. Periods of low rainfall may lead to higher concentrations of pollutants and allergens in the air, while sudden increases in precipitation can promote mold growth, posing additional risks for individuals with respiratory issues.
Figure 6 (down) illustrates the variations in daily average wind speed and daily temperature range. Wind speed remained relatively stable until 2010 but then showed a marked increase, peaking in 2018. While stronger winds can disperse pollutants and temporarily improve air quality, they can also transport dust and pollen over larger areas, aggravating respiratory symptoms for sensitive individuals. Similarly, the daily temperature range has shown considerable fluctuations, with a marked increase in variability since 2013 and a notable peak in 2018. Such temperature swings can be particularly challenging for those with respiratory conditions, as sudden changes are known to trigger asthma and rhinitis attacks and worsen pneumonia symptoms.
The trends depicted in these figures have direct implications for respiratory health. Periods of high humidity and greater temperature variability, as shown in Figure 6 (up and down), often coincide with an increase in hospitalizations due to respiratory diseases, particularly among vulnerable populations such as the elderly and those with preexisting conditions. Higher humidity levels can make it more difficult for people with asthma to breathe, while fluctuating temperatures can exacerbate symptoms of respiratory diseases.
Daily average wind speed remains relatively stable over time, with a few notable spikes, particularly in 2012. From 2012 onward, both wind speed and the daily temperature range show increasing trends, indicating greater variability in both wind intensity and temperature fluctuations during the observed period. These patterns provide valuable insights into the dynamic nature of atmospheric conditions throughout the timeframe, reflecting a shift towards more variable and extreme weather events.
The data presented in these figures highlight the complex relationship between changing weather patterns and public health. The observed rise in atmospheric moisture, combined with increased wind speed and temperature variability, underscores the need for heightened public health awareness and preparedness to mitigate the adverse effects of these environmental changes on respiratory health. Continuous monitoring and research are essential to better understand how evolving climate dynamics influence both the environment and human health. Public health strategies must adapt to these changes to effectively address the rising risks associated with respiratory diseases in the context of shifting weather patterns.
3.6. Air Quality and Respiratory Health
The analysis of air quality data from 2008 to 2019, as depicted in Figure 7 (up and down), provides a detailed view of the behavior of key pollutants, including nitrogen dioxide (NO2), sulfur dioxide (SO2), ozone (O3), and particulate matter (PM10). These trends highlight the effects of regulatory measures, environmental conditions, and emissions from various sources. Figure 7 (up) shows the annual variations in NO2, SO2, and O3 concentrations. NO2 levels exhibit significant fluctuations over the years. A sharp peak in 2016 suggests high emissions from traffic and industrial activities, followed by a gradual decline that is disrupted by another significant increase in 2017. This pattern indicates periods of both effective control measures and renewed emissions, potentially due to changes in policy or industrial activity. After 2018, NO2 concentrations show a marked decline, reflecting more consistent regulatory efforts and reduced emissions. SO2 levels, also shown in Figure 7 (up), display a more irregular pattern. There are notable peaks in 2009, 2014, and 2017, which could be attributed to specific industrial events or lapses in emission controls. Significant drops in 2011 and 2012 suggest temporary successes in reducing SO2 emissions, possibly due to stricter regulations or lower industrial activity during those years. However, the inconsistency in SO2 trends indicates that maintaining low levels remains a challenge and requires continuous monitoring and intervention.
Ozone (O3) concentrations, depicted in both Figure 7 (up) and Figure 7 (down), show a relatively stable trend compared to NO2 and SO2. There is a gradual decline in O3 levels from 2008 to 2015, suggesting improvements in factors influencing ozone formation. After 2015, O3 levels stabilize, with a slight increase observed from 2016 onwards, which may be linked to changes in meteorological conditions or precursor emissions.
Figure 7 (down) focuses on the trends for PM10 and O3. PM10 concentrations show a steep decline from 2008 to 2010, indicating effective measures to control particulate emissions from sources such as construction, transportation, and industry. This initial reduction reflects successful implementation of air quality policies during that period. However, from 2011 onwards, PM10 levels remain relatively stable but begin to show a slight upward trend towards 2019. This increase could be due to a resurgence in particulate emissions, potentially linked to changes in traffic patterns.
These pollutant trends have significant health implications. Elevated SO2 levels are associated with increased hospitalizations for asthma and pneumonia, while high O3 concentrations can exacerbate allergic conditions such as rhinitis. PM10 poses a serious risk to respiratory health, especially for vulnerable populations like children and the elderly. Although there has been a general decline in most pollutants, the occasional surges in NO2 and SO2, along with the recent upward trend in PM10, indicate that improvements in air quality are not uniform. While the overall trend points towards a reduction in pollution levels, the irregular behavior of certain pollutants, particularly SO2 and PM10, suggests that more consistent and targeted interventions are necessary.
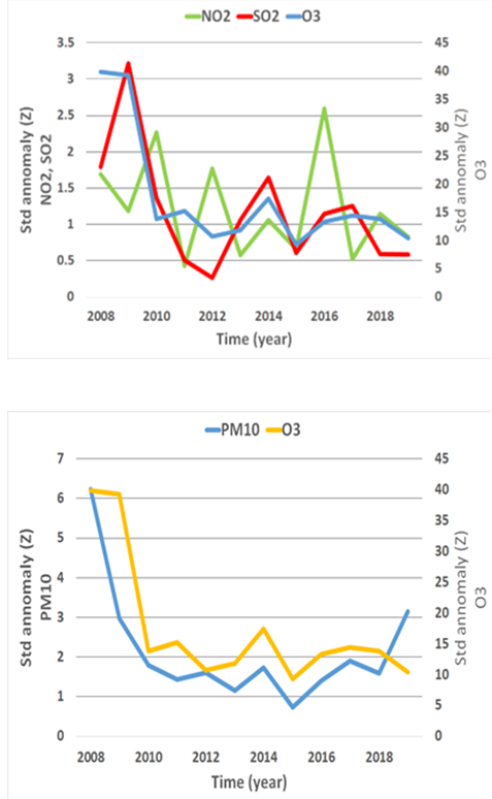
Figure 7. Normalized series of annual averages of concentrations of nitrogen dioxide (NO2), sulphur di-oxide (SO2) (up), particulate matter (PM10) and ozone (O3) (down), observed at the Espalhafatos air quality station (Faial), for the period 2008 to 2019.
3.7. Principal Component Analysis (PCA) Findings
Principal Component Analysis (PCA) was utilized to discern patterns in the data.
The PCA biplot of Figure 8 illustrates the relationships between meteorological variables and their influence on air quality and health outcomes (the three diseases in study) over the years 2008 to 2019. The two principal components, PC1 and PC2, together explain 63.9% of the total variance in the dataset, with PC1 accounting for 44.3% and PC2 for 19.6%. Each year is represented by a coloured dot, and the distribution of these points across the plot reflects how different years vary relative to each other based on the analysed variables.
PC1, which explains the largest proportion of variance, is strongly influenced by temperature-related variables such as maximum temperature (Tmx), minimum temperature (Tmn), and the daily temperature range (Tmx-Tmn). Years like 2018 and 2019, which are positioned on the far right of the plot along PC1, are associated with higher temperatures and greater temperature variability compared to other years. This suggests that these years experienced unusually warm conditions, potentially contributing to changes in air quality and health outcomes.
PC2 is primarily influenced by variables such as relative humidity (HR), atmospheric pressure (Pnm), and cumulative rainfall (Pmm). Years such as 2010 and 2015, which score high on PC2, likely experienced conditions with higher humidity, pressure, and precipitation. These meteorological factors are crucial in understanding the behaviour of air pollutants and their impact on health. The analysis of pneumonia cases reveals significant relationships with various weather-related variables. For instance, the vector for pneumonia cases aligns with humidity (HR) and atmospheric pressure (Pnm), indicating a positive correlation. This suggests that years with higher humidity and pressure levels are associated with an increase in pneumonia cases, highlighting the interaction between weather conditions and respiratory health.
The direction and length of the vectors in the plot further illustrate these relationships. Variables such as HR, Pnm, and cumulative rainfall (Pmm), which are closely aligned, indicate a strong positive correlation. This means that increases in humidity and atmospheric pressure are linked to higher cumulative rainfall and, potentially, greater health impacts, like pneumonia. In contrast, temperature-related variables (Tmx, Tmn, and Tmx-Tmn) are oriented in the opposite direction, suggesting a negative correlation with humidity and pressure. This indicates that years with higher temperatures tend to have lower humidity, which can influence the concentration of certain air pollutants, such as ozone. These results also suggest that hospital admissions appear to be associated with cold days characterized by low thermal amplitude, pointing to the potential impact of colder weather on respiratory infections.
Moreover, the principal component analysis (PCA) highlighted that admissions for pneumonia were negatively correlated with daily temperatures. This suggests that lower temperatures and reduced thermal amplitude are linked to higher pneumonia admissions, pointing to the potential impact of colder weather on respiratory infections. Together, these findings underscore the complex interplay between various weather factors and their effects on respiratory health, particularly pneumonia.
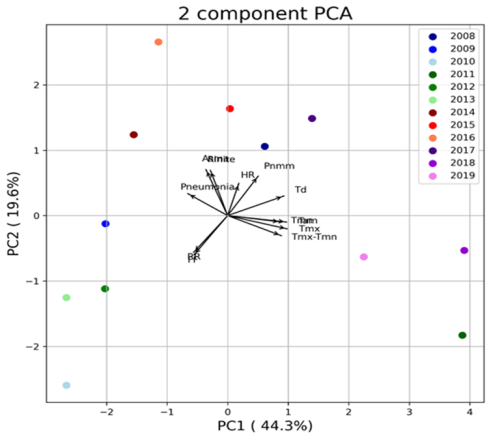
Figure 8. Graphical representation of the first two principal components for the set of meteorological variables and for the diseases under study, for the years 2008 to 2019.
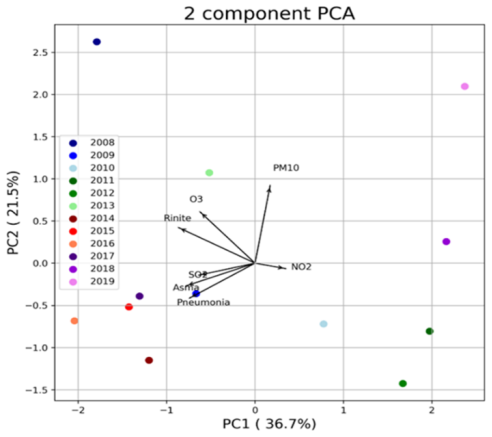
Figure 9. Graphical representation of the first two principal components for the set of air quality variables and for the diseases under study, for the years 2008 to 2019.
Figure 9 illustrates a 2 component PCA plot depicting the relationship between various environmental factors and respiratory health conditions over the years 2008 to 2019. The two principal components, PC1 and PC2, account for 36.7% and 21.5% of the variance, respectively, with a combined total of 58.2% of the data variance. Each colored point in the plot represents data from a specific year, with the colors ranging from dark blue for 2008 to pink for 2019. The arrows in the plot indicate different variables, including pollutants such as PM10, NO2, O3, and SO2, as well as health conditions like rhinitis, asthma, and pneumonia. The direction and length of each arrow suggests how much each variable contributes to the principal components. PM10 and NO2 are strongly associated with PC1, indicating their significant impact on this component, while O3 and rhinitis are more correlated with PC2. Asthma and pneumonia are positioned close to each other, showing a negative correlation with PC1 but less so with PC2. The yearly data points reveal distinct patterns. The years 2008 and 2009 are located far on the positive side of PC2, suggesting that these years had unique conditions compared to the others. In contrast, 2014 and 2015 cluster together with high negative values on PC1, indicating similar patterns. The years 2016 and 2017 are closer to the origin, representing more average conditions, while 2019 stands out on the far positive side of PC1, highlighting a notable change in variables like PM10 and NO2.
The PCA analysis indicates that different pollutants and meteorological conditions play distinct roles in influencing respiratory health. Lower temperatures and reduced thermal amplitude are linked to higher pneumonia admissions, suggesting cold weather as a key risk factor for this disease. High levels of SO2 are associated with increased cases of asthma and pneumonia, while O3 is linked to rhinitis, indicating the significant role of air quality in respiratory allergic responses. Interestingly, NO2 shows a negative correlation with respiratory diseases, potentially due to complex interactions between pollutants. This could be explained by the chemical reaction NO2 undergoes in the atmosphere, where it contributes to ozone production through photolysis (NO2 + O2 + hν ⟶ NO + O2), highlighting the intricate dynamics between air pollutants. Despite being a known respiratory irritant, PM10 does not appear to significantly influence the diseases under study in this analysis. However, its role should not be dismissed, especially for vulnerable populations such as children and the elderly. The findings emphasize the differential impacts of pollutants like SO2 and O3 on respiratory health, underscoring the importance of both air quality and meteorological factors in understanding health trends.
The separation of early years (2008, 2009) from more recent years (2018, 2019) suggests significant changes in environmental conditions and their effects on health outcomes, reflecting the complex interplay of pollutants and meteorological factors in shaping respiratory health.
Figure 10 provides a comprehensive analysis of the relationships between various meteorological and air quality factors and their impact on respiratory health from 2008 to 2019. The two principal components, PC1 and PC2, explain 35.8% and 20.0% of the variance, respectively, together accounting for 55.8% of the total variance. The arrows in the graph represent different environmental variables and health conditions, such as temperature, dew point, humidity, precipitation, wind speed, and pollutants like PM10, NO2, and SO2, alongside respiratory diseases such as asthma, pneumonia, and rhinitis. The direction and length of these arrows indicate their contributions to the principal components and their correlations with each other.
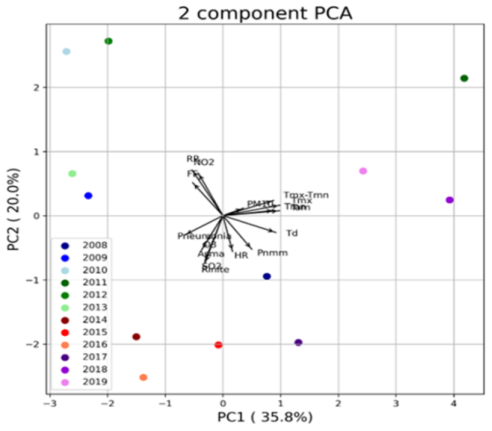
Figure 10. Graphical representation of the first two principal components for the set of variables under study, for the years 2008 to 2019.
Temperature variables, including maximum, minimum, and average temperatures, strongly influence PC1, indicating their significant role in shaping respiratory health outcomes. Meanwhile, NO2, precipitation, and wind speed show negative correlations with PC1, suggesting an inverse relationship with the diseases under study. The positioning of data points for each year reflects different environmental and health conditions over time. For instance, 2018 and 2019 are influenced mainly by temperature-related factors, while 2010 and 2016 are more associated with variables like NO2 and precipitation. The clustering of certain years, such as 2014 and 2015, indicates similar conditions, while the positioning of years like 2008 and 2012, which are isolated on the positive side of PC2, points to unique circumstances affecting those periods.
The analysis suggests that lower temperatures and reduced thermal amplitude are associated with higher pneumonia admissions, indicating that cold weather is a key risk factor for this disease. In contrast, asthma and rhinitis show a less direct association with temperature variations but are significantly influenced by air quality factors. High levels of SO2 are linked to increased hospitalizations for asthma and pneumonia, while elevated ozone concentrations are associated with rhinitis, highlighting the significant impact of air pollution on respiratory conditions. Interestingly, the negative correlation of NO2 with respiratory diseases suggests complex interactions between different pollutants and health outcomes. NO2 might not directly contribute to these conditions but could play a role in the formation of other pollutants, such as ozone, which have more pronounced health impacts. While higher SO2 levels correlate with increased cases of asthma and pneumonia, and elevated ozone levels are linked to rhinitis, PM10 does not show a strong direct association with the diseases under study, indicating that its impact on hospitalizations may be less significant than previously thought.
To further refine the understanding of these findings, additional factors could be considered. For instance, examining lag effects could reveal delayed responses of respiratory diseases to changes in environmental conditions, providing a clearer picture of the timeline for disease exacerbation. Incorporating demographic data, such as age, socioeconomic status, and pre-existing health conditions, would help identify which populations are most affected by these environmental factors. Additionally, including indoor air quality data and lifestyle factors, such as smoking or exposure to household chemicals, could provide a more complete analysis of how various exposures contribute to respiratory health.
Exploring long-term trends related to climate change and their influence on temperature, pollution levels, and extreme weather events would also add depth to the analysis, helping to understand how these factors evolve over time. Furthermore, considering interaction effects between variables, such as the combined impact of NO2 and O3 or temperature and humidity, could offer insights into more complex dynamics affecting respiratory health. Incorporating data on healthcare access and quality could explain regional differences in disease outcomes, while controlling for seasonal trends and geographical factors like altitude or urban versus rural settings could isolate the effects of environmental variables more accurately. Cold weather and high levels of SO2 are linked to increased pneumonia and asthma cases, while other variables, such as wind speed and precipitation, appear less directly associated.
4. Discussion
The present work carried out for Faial shows the existence of relationships between hospitalization patterns and specific meteorological (or climatic) factors (air temperature, dew point, relative humidity, precipitation, and wind) at annual, monthly, and weekly scales. Furthermore, it is evidenced that air quality (NO2, SO2, O3 and PM10) may contribute to a higher number of individuals with treated respiratory diseases.
The contribution of this study carried out for the period of the most recent years and inserted already in the current scenario of climate change study , which focuses on the areas of health (medicine and hospital management) and climate change (impact of global warming on health and human comfort).
The impact of atmospheric factors on human health or, if we want to be more specific, their effective contribution in triggering and exacerbating certain diseases has been increasingly the target of scientific research for different locations and with diverse methodologies. Climate change is predicted to increase the frequency and intensity of extreme weather events, amplifying air pollution levels and exacerbating respiratory diseases, referencing the study .
Thus, the current state of the art shows us that, although there are general aspects that are consensual (for example, air temperature influences asthma), there are still other specific aspects that need to be known (average or minimum or maximum temperature).
Tha _ Air termal Amplitudeological elements and the various combinations of these elements constitute com-plex variables such as (thermal sensation, effective temperature, etc.) that imply a reaction of the body to the environment, study . Climate change has wide-ranging, deleterious effects on respiratory health. The combustion of fossil fuels results in direct health impacts through the release of fine particulate matter and other respiratory disease-promoting factors, taking into account the study . Children are more vulnerable than adults to climate-related health threats, but reviews examining how climate change affects human health have been mainly descriptive and lack an assessment of the magnitude of health effects children face, considering study . The world is sitting on the precipice of an ecological and health crisis, with temperature, extreme events, and pollution continuing to increase as climate change progresses; therefore, quantifying the extent to which these phenomena will affect child health will stimulate better future health policies and clinical protocols, cited in the study .
For example, childhood asthma and adult-onset asthma are known to share many causes and exacerbators, considering the study . Although there is stronger evidence for the role of environmental factors as exacerbators rather than causes, there is growing evidence of interactions between environmental factors and other intrinsic factors, such as genetics and atopy, to potentially cause asthma. Air pollution is one of the leading causes of respiratory diseases like asthma, study . Most childhood onset asthma manifests as an allergic phenotype, whereas there is a predominance of the non-allergic phenotype in adult-onset asthma. However, both allergic and non-allergic asthma can present individual responses to allergic and non-allergic airborne triggers, such as animal dander, pollen and mold (fungal) spores, food allergens, tobacco smoke or other pollutant exposures, referencing the study .
Finally, we must distinguish the role that meteorological factors can play in the disease itself, and in favoring contagion in the case of transmittable diseases such as COVID-19, influenza, or pneumonia (cold, rainy, or even windy weather conditions favor the search for indoor locations often without adequate ventilation and where individuals remain in close contact for periods long enough for contagion).
5. Conclusions
The study findings can be summarized as follows:
1. Asthma hospital admissions may correlate with colder temperatures and reduced thermal amplitudes, indicating prolonged exposure to colder conditions.
2. Local suspension of particles by wind, prevalent in winter, spring, and autumn, could worsen asthma symptoms.
3. Low dew point conditions favor pneumonia cases, while higher dew points may not facilitate their occurrence.
4. Rhinitis shows peaks in late winter and late spring, with colder weather potentially worsening symptoms.
5. Asthma and pneumonia cases are more prevalent in winter and spring, characterized by small daily thermal amplitudes and lower temperature and humidity levels.
6. Primary pollutants like NO2 and SO2 in winter and spring may contribute to in-creased respiratory disease cases, but no clear relationship was found with particulate matter (PM10).
7. Except for rhinitis, there has been a negative trend in total respiratory disease admissions since 2010, possibly influenced by meteorological and air quality trends.
8. Trends over the study period show positive trends in air temperature and average wind speed, and negative trends in rainfall. Relative humidity and dew point show positive trends compared to precipitation. Except for NO2, pollutant concentrations show negative trends.
9. Results suggest associations between pneumonia and asthma with high SO2 concentrations, positive correlation of surface O3 concentrations with rhinitis cases, and negative correlation with NO2. PM10 has a small negative correlation with pneumonia. All three diseases correlate with each other as well as with O3 and SO2.
10. Future research should focus on elucidating the control mechanisms between environmental and genetic factors to identify high-risk populations and modifiable expo-sures. Large-scale longitudinal studies and controlled laboratory experiments are essential for developing personalized prevention and treatment strategies. Interdisciplinary collaborations are crucial for a comprehensive understanding of the complex mechanisms underlying respiratory diseases.
Abbreviations

FF

Wind Speed

HR

Relative Humidity

NO2

Nitrogen Dioxide

O3

Ozone

PCA

Principal Component Analysis

PM10

Particulate Matter with a Diameter of 10 Micrometers or Less

Pnmm

Mean Sea Level Pressure

RDH

Respiratory Diseases Hospitalizations

RR

Total Precipitation

SO2

Sulfur Dioxide

Tam

Mean Air Temperature

TD

Dew Point Temperature

Tmn

Minimum Air Temperature

Tmx

Maximum Air Temperature

Tha

Air Termal Amplitude

Author Contributions
Fernanda Carvalho: Conceptualization, Data curation, Software
Maria Meirelles: Conceptualization, Formal Analysis, Investigation, Methodology, Writing – original draft, Writing – review & editing
Daniela Martins: Data curation, Investigation, Software
Helena Cristina Vasconcelos: Conceptualization, Formal Analysis, Project administration, Supervision, Validation, Writing – original draft, Writing – review & editing
Funding
This work is not supported by any external funding.
Conflicts of Interest
The authors declare no conflicts of interest.
References
[1] Zarocostas, J (2023) WMO calls for greater use of climate services in health. The Lancet, Volume 402, Issue 10414, 1737.
[2] Darnell MER, Subbarao K, Feinstone SM, Taylor DR (2004) Inactivation of the coronavirus that induces severe acute respiratory syndrome, SARS-CoV. J Virol Methods 121: 85–91.
[3] Abe T, Tokuda Y, Ohde S, et al (2009) The relationship of short-term air pollution and weather to ED visits for asthma in Japan. American Journal of Emergency Medicine 27: 153–159.
[4] Li M, Li Q, Yang G, et al (2011) Cold temperature induces mucin hypersecretion from normal human bronchial epithelial cells in vitro through a transient receptor potential melastatin 8 (TRPM8)-mediated mechanism. Journal of Allergy and Clinical Immunology 128.
[5] Douglas – Vail M, Jiang A, Erdelyi S, Brubacher JR, Abu-Laban RB. (2023). Association of air quality during forest fire season with respiratory emergency department visits in Vancouver, British Columbia. The Journal of Climate Change and Health, Volume 13, 100255, ISSN 2667-2782,
[6] Kangas T, Gadayne S, Lefebre, W, Vanpoucke C, Rodriguez-Loureiro L (2023). Are air quality perception and PM2.5 exposure differently associated with cardiovascular and respiratory disease mortality in Brussels? Findings from a census-based study. Environmental Research 219 (2023) 115180.
[7] Anderson, J. O., Thundiyil, J. G. & Stolbach, A. Clearing the Air: A Review of the Effects of Particulate Matter Air Pollution on Human Health. J. Med. Toxicol. 8, 166–175 (2012).
[8] Pranata R, Huang I, Lim MA, Wahjoepramono EJ, July J. Impact of cerebrovascular and cardiovascular diseases on mortality and severity of COVID-19-systematic review, meta-analysis, and meta-regression. J Stroke Cerebrovasc Dis. 2020 Aug; 29(8): 104949. Epub 2020 May 14. PMID: 32410807; PMCID: PMC7221373.
[9] Nieuwenhuijsen MJ, Basagaña X, Dadvand P, Martinez D, Cirach M, Beelen R, Jacquemin B, (2014). Air pollution and human fertility rates, Environment International, Volume 70, Pages 9-14, ISSN 0160-4120,
[10] Chen J, Hoek G. Long-term exposure to PM and all-cause and cause-specific mortality: A systematic review and meta-analysis. Environ Int. 2020 Oct; 143: 105974. Epub 2020 Jul 20. PMID: 32703584.
[11] Hoek, G., Krishnan, R. M., Beelen, R. et al. Long-term air pollution exposure and cardio- respiratory mortality: a review. Environ Health 12, 43 (2013).
[12] Hvidtfeldt UA, Sørensen M, Geels C, Ketzel M, Khan J, Tjønneland A, Overvad K, Brandt J, Raaschou-Nielsen O. Long-term residential exposure to PM2.5, PM10, black carbon, NO2, and ozone and mortality in a Danish cohort. Environ Int. 2019 Feb; 123: 265-272. Epub 2018 Dec 12. PMID: 30551059.
[13] Mireku N, Wang Y, Ager J, Reddy RC, Baptist AP. Changes in weather and the effects on pediatric asthma exacerbations. Ann Allergy Asthma Immunol. 2009 Sep; 103(3): 220-4. PMID: 19788019.
[14] Marno P, Bryden C, Bird W, Watkin HA (2006) How different measures of cold weather affect chronic obstructive pulmonary disease (COPD) hospital admissions in London. European Respiratory Review 15: 185–186.
[15] Koskela HO (2017) Cold air-provoked respiratory symptoms: the mechanisms and management Cold Air-Provoked Res-piratory Symptoms: The Mechanisms and Management. 3982.
[16] Michelozzi P, Accetta G, De Sario M, et al (2009) High Temperature and Hospitalizations for Cardiovascular and Respiratory Causes in 12 European Cities. Am J Respir Crit Care Med 179: 383–389.
[17] Strickland MJ, Darrow LA, Klein M, et al (2010) Short-term Associations between Ambient Air Pollutants and Pediatric Asthma Emergency Department Visits. Am J Respir Crit Care Med 182: 307–316.
[18] Zhang Y, Peng L, Kan H, et al (2014) Effects of meteorological factors on daily hospital admissions for asthma in adults: A time-series analysis. PLoS One 9:
[19] Fitzgerald EF, Pantea C, Lin S (2014) Cold Spells and the Risk of Hospitalization for Asthma: New York, USA 1991–2006. Lung 192: 947–954.
[20] Bodaghkhani E, Mahdavian M, Maclellan C, et al (2019) Effects of meteorological factors on hospitalizations in adult patients with asthma: A systematic review. Can Respir J 2019:
[21] Dharmage SC, Perret JL, Custovic A (2019) Epidemiology of asthma in children and adults. Front Pediatr 7.
[22] To T, Stanojevic S, Moores G, et al (2012) Global asthma prevalence in adults: Findings from the cross-sectional world health survey. BMC Public Health 12: 204.
[23] Koper I, Hufnagl K, Ehmann R (2017) Gender aspects and influence of hormones on bronchial asthma - Secondary publication and update. World Allergy Organization Journal 10: 1–7.
[24] Caetano, M., Santos, A., Carvalho, B., Cordeiro, C., Barreto, C., Gomes, E., Barata, F., Félix, F., Queiroga, H., Bernardo, J., Cardoso, J., Bandera, T., Brito, U., Hespanhol, V (2015). Pneumologia. Rede Nacional de Especialidade Hospitalar e de Refe-renciação. Ministério da Saúde. Governo de Portugal. Lisboa.
[25] Sousa C, Soares A, Morais L, Silva R (2019) Indicadores de Saúde 2013 - 2018, Região Autónoma dos Açores. Angra do Heroismo.
[26] Carvalho F, Martins D, Meirelles M, Vasconcelos H (2022a) Weather and Air Quality Factors Contribution to the Hospital Admissions of Patients with Respiratory Diseases : Case Study of Faial Island (Azores). 31:
[27] Arias PA, Bellouin N, Coppola E, et al (2021) Technical Summary. In: Masson-Delmotte V, P. Zhai PA, Connors SL, et al. (eds) Climate Change 2021: The Physical Science Basis. Contribution of Working Group I to the Sixth Assessment Report of the Intergovernmental Panel on Climate Change
[28] Carvalho F, Meirelles M, Henriques D, et al (2022b) Climate Change and the Increase of Extreme Events in Azores. In: Leal Filho W (ed) Handbook of Human and Planetary Health. Climate Change Management. Springer,
[29] Hernández A, Kutiel H, Trigo RM, Valente MA, Sigró J, Cropper T, Santo FE 2016). New Azores archipelago daily precipi-tation dataset and its links with large-scale modes of climate variability. Int. J. Climatol., 36 (2016), pp. 4439-4454,
[30] Huan Minh Tran, Feng-Jen Tsai, Yueh-Lun Lee, Jer-Hwa Chang, Li-Te Chang, Ta-Yuan Chang, Kian Fan Chung, Han-Pin Kuo, Kang-Yun Lee, Kai-Jen Chuang, Hsiao-Chi Chuang (2023). The impact of air pollution on respiratory diseases in an era of climate change: A review of the current evidence. Science of The Total Environment, Volume 898, 166340, ISSN 0048-9697.
[31] Anjeni Keswani, Hana Akselrod, Anenberg Susan C. Health and clinical impacts of air pollution and linkages with climate change. NEJM Evidence 2022; 1: EVI Dra2200068.
[32] Lewis J. Z. Weeda, Corey J. A. Bradshaw, Melinda A. Judge, Chitra M. Saraswati, Peter N. Le Souëf (2024). How climate change degrades child health: A systematic review and meta-analysis. Science of The Total Environment, Volume 920, 170944, ISSN 0048-9697.
[33] Landsberg HE (1972) The Assessment of Human Bioclimate - a limited review of physical parameters. World Meteorological Organization TECHNICAL: 1–36.
[34] Damini Singh, Indrani Gupta, Arjun Roy (2023). The association of asthma and air pollution: Evidence from India. Economics & Human Biology, Volume 51, 101278, ISSN 1570-677X.
Cite This Article
  • APA Style

    Carvalho, F., Meirelles, M., Martins, D., Vasconcelos, H. C. (2024). Yearly Assessment of Weather and Air Quality Impact on Respiratory Disease Hospitalizations: Faial Island (Azores) Study. American Journal of Health Research, 12(6), 165-178. https://doi.org/10.11648/j.ajhr.20241206.12

    Copy | Download

    ACS Style

    Carvalho, F.; Meirelles, M.; Martins, D.; Vasconcelos, H. C. Yearly Assessment of Weather and Air Quality Impact on Respiratory Disease Hospitalizations: Faial Island (Azores) Study. Am. J. Health Res. 2024, 12(6), 165-178. doi: 10.11648/j.ajhr.20241206.12

    Copy | Download

    AMA Style

    Carvalho F, Meirelles M, Martins D, Vasconcelos HC. Yearly Assessment of Weather and Air Quality Impact on Respiratory Disease Hospitalizations: Faial Island (Azores) Study. Am J Health Res. 2024;12(6):165-178. doi: 10.11648/j.ajhr.20241206.12

    Copy | Download

  • @article{10.11648/j.ajhr.20241206.12,
      author = {Fernanda Carvalho and Maria Meirelles and Daniela Martins and Helena Cristina Vasconcelos},
      title = {Yearly Assessment of Weather and Air Quality Impact on Respiratory Disease Hospitalizations: Faial Island (Azores) Study
    },
      journal = {American Journal of Health Research},
      volume = {12},
      number = {6},
      pages = {165-178},
      doi = {10.11648/j.ajhr.20241206.12},
      url = {https://doi.org/10.11648/j.ajhr.20241206.12},
      eprint = {https://article.sciencepublishinggroup.com/pdf/10.11648.j.ajhr.20241206.12},
      abstract = {Building upon our previous research conducted at weekly and monthly intervals, this study investigates the yearly dynamics of weather conditions and air quality on respiratory diseases, specifically tailored to Faial Island in the Azores. Expanding our analysis to a yearly basis allows for a more comprehensive understanding of long-term trends and seasonal variations in hospital admissions. Drawing upon extensive daily data spanning from 2008 to 2019, sourced from the Statistics Service of Hospital da Horta, the Meteorological Observatory Príncipe Alberto de Mónaco, and the Air Quality Monitoring Network of the Azores, we examined the differentiated relationships between yearly meteorological variables, such as temperature, dew point, and wind direction, and respiratory health outcomes. Additionally, we explored the persistent influence of air quality indicators, including suspended particulate matter with an aerodynamic diameter of 10 micrometers (µm) or less (PM10), sulfur dioxide (SO2), nitrogen dioxide (NO2), and ozone (O3), across different seasons and years. By incorporating yearly data into our analysis, this study aims to provide a comprehensive and nuanced understanding of the interplay between environmental factors and respiratory disease hospitalizations, thereby informing targeted interventions and public health strategies in insular regions. The principal component analysis (PCA) applied to the yearly data reveals interesting correlation patterns between meteorological variables and hospitalizations for respiratory diseases such as asthma, pneumonia, and rhinitis. Hospital admissions were found to increase during periods of lower temperatures and smaller temperature amplitudes, suggesting that prolonged cold conditions may exacerbate symptoms of these diseases. Additionally, atmospheric pollutant concentrations, such as suspended particles PM10, SO2, NO2, and O3, significantly varied across seasons, with a notable influence on the exacerbation of respiratory diseases. In insular regions like the Azores, these findings highlight the importance of targeted public health strategies to mitigate the impact of environmental factors on respiratory health.
    },
     year = {2024}
    }
    

    Copy | Download

  • TY  - JOUR
    T1  - Yearly Assessment of Weather and Air Quality Impact on Respiratory Disease Hospitalizations: Faial Island (Azores) Study
    
    AU  - Fernanda Carvalho
    AU  - Maria Meirelles
    AU  - Daniela Martins
    AU  - Helena Cristina Vasconcelos
    Y1  - 2024/11/18
    PY  - 2024
    N1  - https://doi.org/10.11648/j.ajhr.20241206.12
    DO  - 10.11648/j.ajhr.20241206.12
    T2  - American Journal of Health Research
    JF  - American Journal of Health Research
    JO  - American Journal of Health Research
    SP  - 165
    EP  - 178
    PB  - Science Publishing Group
    SN  - 2330-8796
    UR  - https://doi.org/10.11648/j.ajhr.20241206.12
    AB  - Building upon our previous research conducted at weekly and monthly intervals, this study investigates the yearly dynamics of weather conditions and air quality on respiratory diseases, specifically tailored to Faial Island in the Azores. Expanding our analysis to a yearly basis allows for a more comprehensive understanding of long-term trends and seasonal variations in hospital admissions. Drawing upon extensive daily data spanning from 2008 to 2019, sourced from the Statistics Service of Hospital da Horta, the Meteorological Observatory Príncipe Alberto de Mónaco, and the Air Quality Monitoring Network of the Azores, we examined the differentiated relationships between yearly meteorological variables, such as temperature, dew point, and wind direction, and respiratory health outcomes. Additionally, we explored the persistent influence of air quality indicators, including suspended particulate matter with an aerodynamic diameter of 10 micrometers (µm) or less (PM10), sulfur dioxide (SO2), nitrogen dioxide (NO2), and ozone (O3), across different seasons and years. By incorporating yearly data into our analysis, this study aims to provide a comprehensive and nuanced understanding of the interplay between environmental factors and respiratory disease hospitalizations, thereby informing targeted interventions and public health strategies in insular regions. The principal component analysis (PCA) applied to the yearly data reveals interesting correlation patterns between meteorological variables and hospitalizations for respiratory diseases such as asthma, pneumonia, and rhinitis. Hospital admissions were found to increase during periods of lower temperatures and smaller temperature amplitudes, suggesting that prolonged cold conditions may exacerbate symptoms of these diseases. Additionally, atmospheric pollutant concentrations, such as suspended particles PM10, SO2, NO2, and O3, significantly varied across seasons, with a notable influence on the exacerbation of respiratory diseases. In insular regions like the Azores, these findings highlight the importance of targeted public health strategies to mitigate the impact of environmental factors on respiratory health.
    
    VL  - 12
    IS  - 6
    ER  - 

    Copy | Download

Author Information
  • Portuguese Institute for Sea and Atmosphere (IPMA), Ponta Delgada, Portugal

    Biography: Fernanda Carvalho is a graduate in Physics – Atmospheric Physics from the University of Aveiro (1988) and holds a master’s degree in Geophysical Sciences – Meteorology from the University of Lisbon (1998). She has extensive experience in meteorology, particularly in atmospheric observation, forecasting, and radiation studies. She joined the National Institute of Meteorology and Geophysics as a senior meteorologist in 1992 and led the implementation of the UV Index Forecasting Program in Portugal from 1999. She coordinated the Azores Weather Forecasting and Surveillance Center (2015-2019) and currently works at the Portuguese Institute for Sea and Atmosphere. She has contributed to numerous scientific publications and research projects, and lectures at the University of the Azores.

  • Faculty of Science and Technology, University of the Azores, Ponta Delgada, Portugal; Research Institute of Marine Sciences, University of the Azores, Faial, Portugal

    Biography: Maria Meirelles has a Diploma in Physics from the State University of Rio de Janeiro, Brasil in 1992, a Geophysics Master in the field of Meteorology from University of Lisbon (Faculty of Sciences), Portugal in 1997 and got her PhD in Physics from the Azores University (UAC), Portugal in 2009, in the field of Geophysical Sciences. Her teaching activities include topics on meteorology/atmosphere/climatology, general physics, physics for biology and geophysics, among others, for undergraduate and master studies. She has participated in several scientific conferences, and she has published several research articles.

  • Faculty of Science and Technology, University of the Azores, Ponta Delgada, Portugal

    Biography: Daniela Martins holds a degree in Biology and a Master’s in Environment, Heath and Security from the University of the Azores. She is currently conducting research on the impact of weather and air quality on respiratory disease hospitalizations. Her work[ focuses on analysing how meteorological variables and air pollutants affect respiratory health, contributing to the understanding and mitigation of risks associated with adverse environmental conditions.

  • Faculty of Science and Technology, University of the Azores, Ponta Delgada, Portugal; Laboratory of Instrumentation, Biomedical Engineering and Radiation Physics, Department of Physics, NOVA School of Science and Technology, Caparica, Portugal

    Biography: Helena Cristina Vasconcelos is an Associate Professor at the Faculty of Science and Technology of Azores University. She is a research member of the Laboratory for Instrumentation, Biomedical Engineering and Radiation Physics (LIBPhys). She has received her Bachelor’s degree in Physics and Materials Engineering in 1990 from NOVA University of Lisbon, obtaining, in 1999, the PhD in Materials Engineering from Instituto Superior Técnico, Lisbon. Her main research interests are in optical materials, fluorescence, and photonics (rare-earth doped glasses). Other interests include the development of materials for commercial use in solid targets to produce radioisotopes in low/medium energy cyclotrons.

  • Abstract
  • Keywords
  • Document Sections

    1. 1. Introduction
    2. 2. Methods
    3. 3. Results
    4. 4. Discussion
    5. 5. Conclusions
    Show Full Outline
  • Abbreviations
  • Author Contributions
  • Funding
  • Conflicts of Interest
  • References
  • Cite This Article
  • Author Information